We regularly talk to clinic owners who wonder why their schedule is full near the office but empty just two miles away. This exact frustration makes a local seo heatmap geogrid dentist analysis incredibly valuable. Recent 2026 data shows that 42% of local search clicks go straight to the top three Map Pack results.
Our team uses these visual grids to completely eliminate marketing guesswork. A traditional ranking report might claim you rank third for “Invisalign,” but that single number hides massive geographic variations.
We will explain exactly what these maps reveal and how to use the data to capture more nearby patients.
What the heatmap actually shows
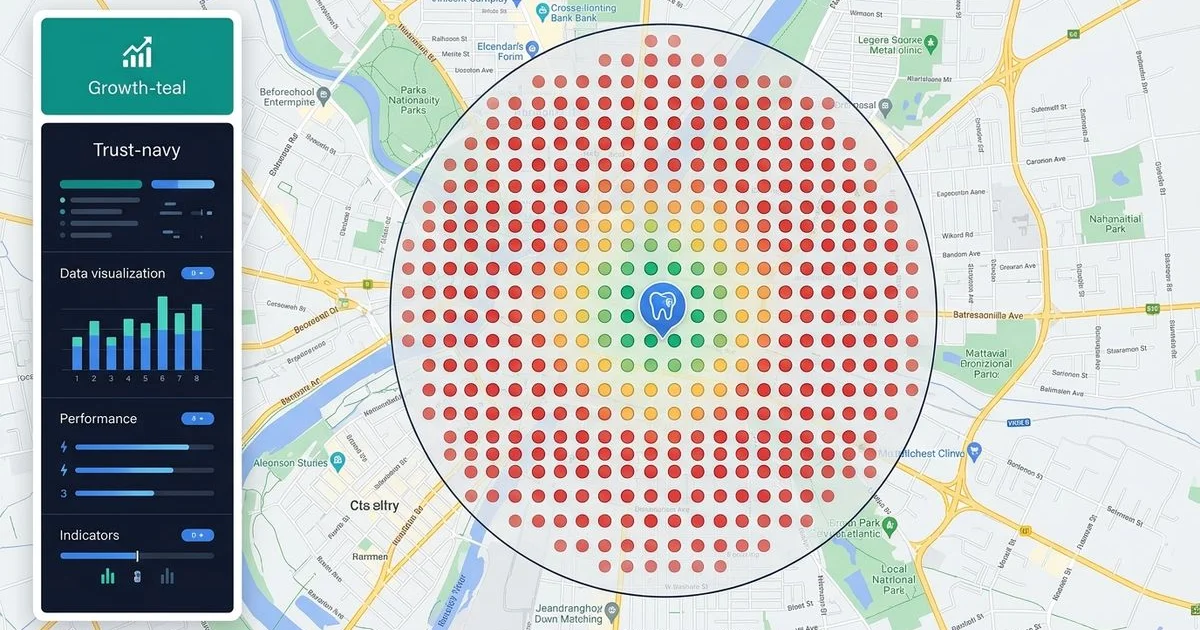
The Geogrid tool plots a precise grid of search points across your service area to show your exact Google Maps position at every intersection. It simulates a patient standing at each specific GPS coordinate searching for your practice. Our preferred setup involves running a 5x5 or 7x7 grid using platforms like Local Falcon or Whitespark. A 1-mile spacing setting perfectly maps dense urban clinics, while a 2-mile spacing fits suburban practices much better.
We look at the color-coded results to instantly gauge performance. Each specific point gets assigned a color based on its local ranking.
- Green: You rank in the top 3 (Map Pack), capturing the majority of local clicks.
- Yellow: You rank 4-10, meaning patients have to click “More places” to find you.
- Orange: You rank 11-20, putting you far out of view for the average mobile searcher.
- Red: You rank 21 or lower, rendering your clinic virtually invisible at that specific location.
Reading the resulting map tells you immediately where your local visibility dominates and where it rapidly falls off.
What patterns mean
Heatmaps rarely show random results, as Google relies heavily on the proximity factor to serve nearby users. Our analysts look for four distinct visual patterns to diagnose underlying local SEO issues. Identifying the right pattern is the first step toward fixing the problem.
Tight green cluster around your office, red further out
You rank well very close to your practice but lose visibility as the physical distance grows. This is the most standard pattern for any local business. We expect to see this proximity drop-off, which usually means you need to expand your local prominence to reach further. Building targeted citations, earning local links, and increasing review velocity will help push those green pins outward.
Patchy green and yellow with random red zones
This messy visual indicates highly inconsistent local relevance across your city. Our audits typically reveal Name, Address, and Phone number (NAP) inconsistencies causing these random drops. Missing Google Business Profile attributes or a very strong competitor in a specific micro-neighborhood can also create these red patches.
Almost entirely red, even near your office
A sea of red indicates a fundamental Google Business Profile problem. We see this often with newly opened clinics that have zero local trust signals built up yet. Severe optimization gaps or an algorithmic suspension are the other likely culprits here.
Strong green far from your office
Ranking well miles away while struggling nearby is highly unusual. Our troubleshooting process usually uncovers a duplicate listing or a similarly named business causing confusion. You need to investigate this anomaly immediately to prevent Google from sending patients to the wrong location.
| Heatmap Pattern | Primary Diagnosis | Immediate Action Required |
|---|---|---|
| Tight Green Cluster | Normal proximity drop-off | Build reviews and local citations |
| Patchy Red/Yellow Zones | Inconsistent local data | Audit NAP directories for old phone numbers |
| Uniformly Red Map | Profile penalty or brand new clinic | Verify GBP status and core optimizations |
| Distant Green Zones | Algorithmic confusion | Hunt for and merge duplicate listings |
How a Geogrid guides strategy
Use the heatmap to prioritize your exact marketing steps for the next quarter. Our approach to geogrid dental seo relies on matching the right tactic to the specific map pattern. For proximity-limited drop-offs, focus entirely on prominence work.
We offset distance penalties by accelerating review collection, as 2026 data shows reviews carry roughly 16% of the local algorithm weight. Citation building and local link earning also help push your reach into neighboring zip codes.
For patchy zones or uniformly weak maps, conduct a thorough audit of your digital foundation. Our specialists frequently execute these specific fixes to restore visibility:
- Audit NAP Data: Check for old clinic addresses lingering on major healthcare directories.
- Update Business Hours: Google’s 2026 algorithm heavily favors profiles with accurate, extended operating hours.
- Verify Categories: Ensure your primary Google Business Profile category precisely matches your highest-value service.
We prioritize these core optimizations before investing in any advanced content strategies. Technical SEO must be solid for local map pins to move.
How we use it in monthly reporting
Month-over-month comparisons are the only reliable way to prove whether your marketing is actually working. Our local dental SEO program includes monthly tracking for your priority keywords to document this progress. Tracking the shift from red pins to green pins shows exactly how your geographic reach is expanding over time.
If you have never seen a local rank heatmap dentist report for your own practice, request a free 30-point audit. We will generate a custom grid as part of the diagnostic process to reveal exactly why your current patient volume feels uneven. This data provides total clarity on where to focus your budget.
For the broader local-ranking process, read how to rank a dental clinic on Google Maps.